
GTP Engine
The computer player in this app is powered by the open source software library Fuego (external link). Behind the scenes the app and Fuego talk to each other via GTP - the Go Text Protocol. In the GTP context, Fuego is called the GTP engine, while the app is the GTP client.
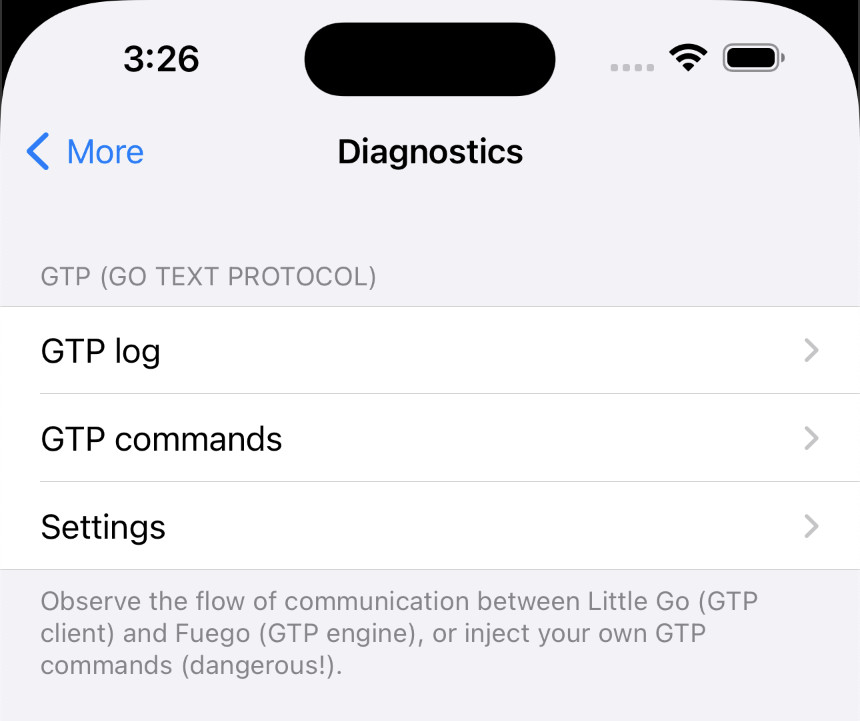
In the Diagnostics area of the app there are a few items at the top of the screen that let you peek into what’s going on between GTP client (the app) and the GTP engine (Fuego).
The “GTP log” item calls up a screen where you can observe the flow of communication between GTP client and engine. You can even interfere with it by injecting your own GTP commands.
WarningBe careful not to disrupt normal operations! If things go badly you may need to force-quit the app and, in the worst case, you may even lose the game that is currently in progress. Games saved in the archive are never affected by GTP commands, though.
The “GTP commands” item calls up a screen where you can view and manage the list of pre-defined GTP commands that can be injected into the GTP communication.
The “Settings” item calls up a screen where you can change a few GTP-related settings.
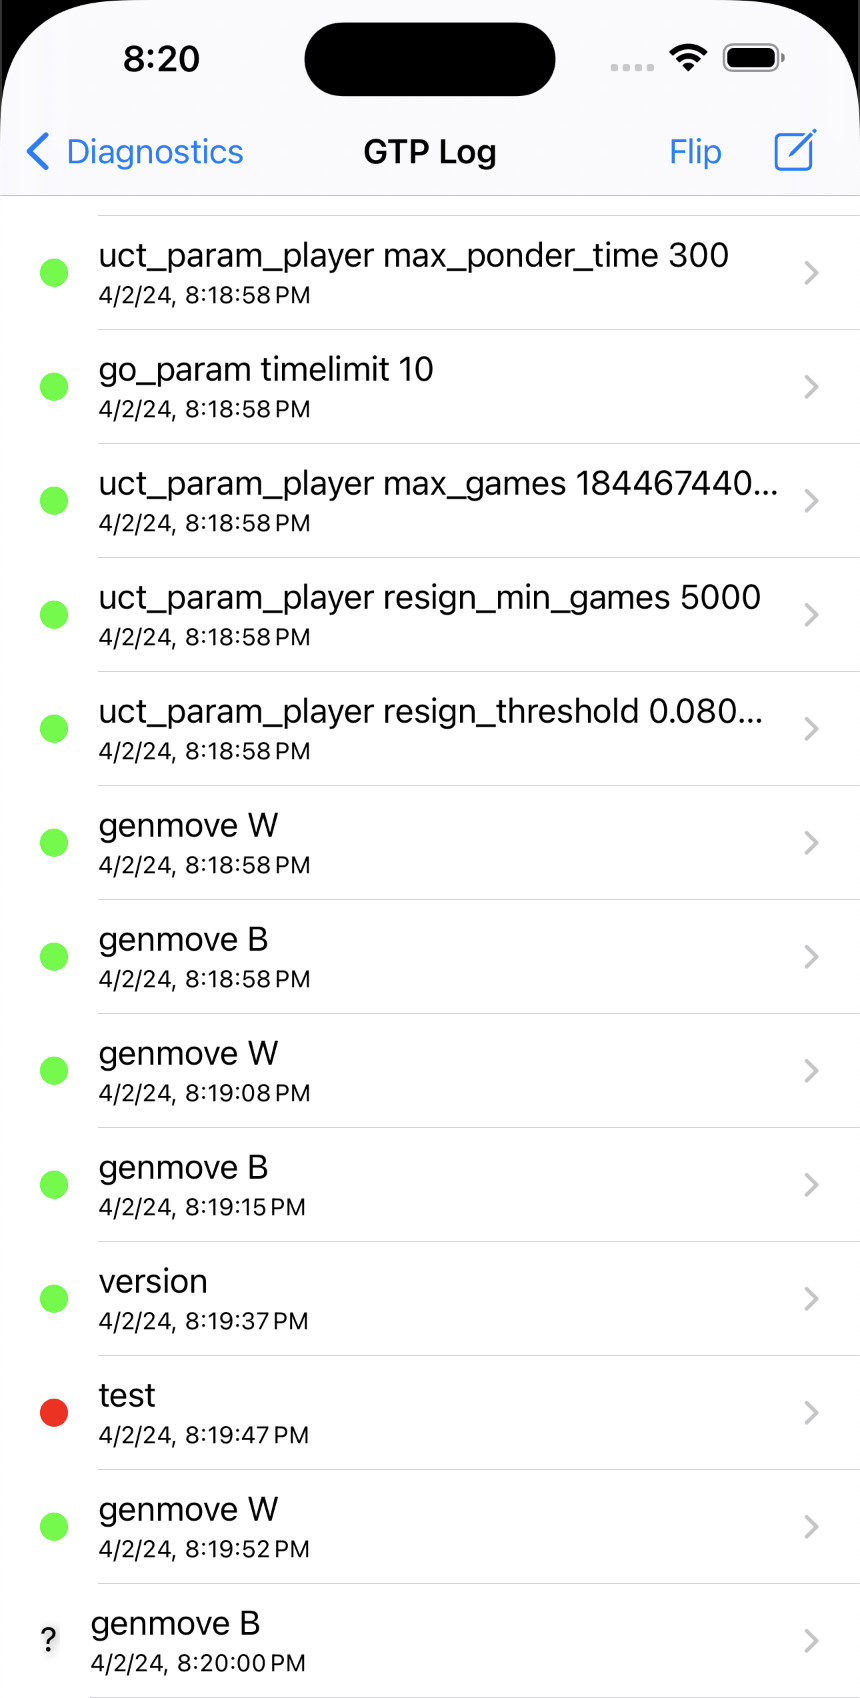
The “GTP log” screen displays the last 100 GTP commands sent, and the responses received. The log size can be changed in the Diagnostics area of the app under “Settings > GTP log size”.
Commands are listed in the order in which they were submitted by the GTP client. The most recent command appears at the bottom of the log. The log is dynamically updated when a new GTP command/response is submitted to or received from the GTP engine. You can empty the log in the Diagnostics area of the app under “Settings > Clear GTP log”.
Each log entry displays the name of the GTP command and the time when it was sent to the GTP engine. Log entries are also color-coded to mark which type of response was received by the GTP client:
- Green means a “success” response.
- Red means a “failure” response.
- A gray question mark ("?") means that the GTP client is still waiting for a response.
The “Flip” toolbar button can be used to switch between the table-oriented view and the “raw” view of the GTP log.
The New toolbar button can be used to inject your own GTP command into the communication flow between GTP client and engine. Tapping the button displays a screen where you can enter a command using free-form text, or you can select a command from a list of pre-defined commands.
When you tap an entry in the GTP log, a screen with detail information for that entry is displayed. Most of the information you see here is already available in the log itself. There is one more detail, though, and that is the detailed response string. Most of the time the response to a GTP command just consists of the success/failure status, but for some commands (e.g. “genmove B”) the response contains more information that is only available on this screen.
The “+” toolbar button lets you add the command to the list of pre-defined commands. If there is no “+” button, the command is already pre-defined.
Selecting the “GTP commands” item in the Diagnostics area of the app calls up a screen where you can view and manage a list of pre-defined GTP commands. Usually these will be often-used or complicated commands that you do not want to re-type every time you need to submit them.
NoteCommands are submitted in the “GTP log” screen.
The “Edit” toolbar button lets you delete and re-arrange commands, while the “+” toolbar button allows you to add a new command to the list. Tapping an entry in the list presents a detail screen where you can edit the command string.
The application comes with a factory set of pre-defined commands which you can freely edit. You can discard your current set and return to the factory set in the Diagnostics area of the app under “Settings > Reset predefined commands”.